Vdbench Curve
Some time back I wrote about the relationship between Queue Depth, IOPS and Latency.
This relationship can be particularly tricky when you're attempting to use performance testing tools to discover the characteristics of your storage. Most testing tools use the number of threads to control the workload they are generating, but this can be troublesome - too few "threads" (aka Queue depth) and you won't be able to generate enough traffic to give a realistic number of IOPS, too many "threads" and you'll end up artificially pushing the latency higher due to queuing occurring in the testing tools or on the host.
Most of the time I see people complaining about poor performance during testing it's due to them having the number of threads set incorrectly - either too high or too low. The problem is, how do you know what the "right" number of threads to use is - especially given that the right number will vary depending on the exact workload you're attempting to generate.
The good news is that Vdbench contains functionality that can be used to (mostly) make the number of threads irrelevant. In addition to workload controls based on threads, Vdbench also allows you to control the workload based on a set number of IOPS - but how do you know how many IOPS you should ask it to generate? Just like with the number of threads, too few and you'll get lower performance than is possible, and too many and you'll get higher latency.
That's where the "curve" feature comes in. By using "curve" you can tell Vdbench to push the array as hard as possible (irrespective of latency) to discover the maximum possible number of IOPS for a specific workload - and then have it automatically re-run the test at specific percentages of that workload to show how latency changes as the number of IOPS changes.
Note that the number of threads configured is still important as it will control the maximum number of IOPS achieved. The difference is that for the subsequent runs Vdbench will only use as many (active) threads as it needs for the requested number of IOPS, so having a higher number of threads configured won't impact the latency. As a result, it's a good idea to set the number of threads to a relatively high number in order to get the highest possible results during the maximum run - whilst knowing the the high number of threads won't impact the latency on the subsequent constrained runs.
Configuration
"Curve" is configured as a part of the run description (rd) in the Vdbench config file, and there are two options that need to be set. The first is that curve needs to be enabled, which is done by setting the iorate to curve ("iorate=curve"). The second is to define what iorates will be tested, which is defined as a percentage of the maximum rate achieved during the first run ("curve=X,Y,Z").
For example :
rd=myrd,wd=mywd,iorate=curve,curve=(10,50,90),interval=1,elapsed=60,warmup=30,threads=512
This configuration will result in a total of 4 tests being run. The first will run as if you had set "iorate=max" in order to determine the maximum number of IOPS that the storage is capable of. As we've configured a very large number of threads, the latency for this run will likely be very high (due to host-level queuing) - but that's OK as we are not going to take the latency from this run into account.
After the maximum number of IOPS has been determined, three further runs will be done with a fixed number of IOPS being 10%, 50% and 90% of the maximum number achieved. For example, if the maximum run achieve 100,000 IOPS, then Vdbench would re-run the test as if it was configured with iorate=10000, then again with iorate=50000, and finally with iorate=90000.
These subsequent tests will still be using 512 threads, but as they are rate-limited not all of the threads will be actively used, so the latency reported for these results will be meaningful.
Normally you'd want more than 3 datapoints, so something like this might be more realistic :
rd=myrd,wd=mywd,iorate=curve,curve=(1,10,20,30,40,50,60,70,80,85,90,92,94,96,98),interval=1,elapsed=60,warmup=15,threads=512
This will run a total of 15 tests (each for 60 seconds plus a 15 second warmup period). Notice that the percentages get closer together as they get closer to 100% - that's a good idea due to the fact that latency normally begins to increase exponentially as you get closer to maximum workload, so the more datapoints the clearer you'll see this climb occurring.
Sample Results
Vdbench doesn't do a great job of displaying the results for a curve run, but with the logfiles and a few grep commands you can get the information you need...
Notice how the first run has an "Uncontrolled" I/O Rate as it tries to determine the maximum IOPS that can be generated (which turned out to be around 131K), however each of the subsequent runs has a fixed I/O rate, corresponding to the displayed percentage of the maximum IOPS rate.
[root@vdb1 output]# egrep 'Starting|avg_' logfile.html | grep -v name
12:54:19.001 Starting RD=myrd; I/O rate: Uncontrolled curve; elapsed=60 warmup=15; For loops: threads=256
12:55:34.056 avg_16-75  130848.33  1022.25    8192  70.02    3.913    3.988    3.736 2903.534   37.542 511.2  13.1   9.5
12:55:35.000 Starting RD=myrd_(1%); I/O rate: 1400; elapsed=60 warmup=15; For loops: threads=256
12:56:50.049 avg_16-75    1394.35    10.89    8192  69.98    0.508    0.549    0.410   16.321    0.302   0.7   1.3   0.5
12:56:51.001 Starting RD=myrd_(10%); I/O rate: 13100; elapsed=60 warmup=15; For loops: threads=256
[...trimmed...]
13:05:42.047 avg_16-75   91588.73   715.54    8192  70.01    0.817    0.884    0.662    6.925    0.247  74.9  17.6  12.0
13:05:43.001 Starting RD=myrd_(80%); I/O rate: 104700; elapsed=60 warmup=15; For loops: threads=256
13:06:58.047 avg_16-75  104663.12   817.68    8192  70.02    0.897    0.972    0.721   97.217    0.437  93.8  20.0  13.9
13:06:59.001 Starting RD=myrd_(85%); I/O rate: 111300; elapsed=60 warmup=15; For loops: threads=256
13:08:14.046 avg_16-75  111303.08   869.56    8192  69.97    0.953    1.028    0.779   53.824    0.494 106.1  21.3  14.8
13:08:15.000 Starting RD=myrd_(90%); I/O rate: 117800; elapsed=60 warmup=15; For loops: threads=256
13:09:30.044 avg_16-75  117909.40   921.17    8192  69.97    1.286    1.357    1.120  107.745    1.885 151.6  22.7  16.0
13:09:31.001 Starting RD=myrd_(92%); I/O rate: 120400; elapsed=60 warmup=15; For loops: threads=256
13:10:46.045 avg_16-75  120431.68   940.87    8192  70.03    2.006    2.077    1.842  701.077    5.190 241.6  21.7  15.4
13:10:47.000 Starting RD=myrd_(94%); I/O rate: 123000; elapsed=60 warmup=15; For loops: threads=256
13:12:02.046 avg_16-75  122928.38   960.38    8192  70.01    2.891    2.963    2.724  563.444    8.809 355.7  19.4  14.0
13:12:03.001 Starting RD=myrd_(96%); I/O rate: 125700; elapsed=60 warmup=15; For loops: threads=256
13:13:18.045 avg_16-75  125771.45   982.59    8192  70.03    3.862    3.948    3.660 2393.662   21.914 485.6  15.3  11.6
13:13:19.000 Starting RD=myrd_(98%); I/O rate: 128300; elapsed=60 warmup=15; For loops: threads=256
13:14:34.045 avg_16-75  127696.82   997.63    8192  70.00    3.945    4.001    3.814 1903.486   27.377 504.4  16.0  11.7
As expected, as the number of IOPS goes up, so does the latency - slowly at first, but significantly towards the end as we begin to get into the exponential range. This is even more obvious when graphing the results above :
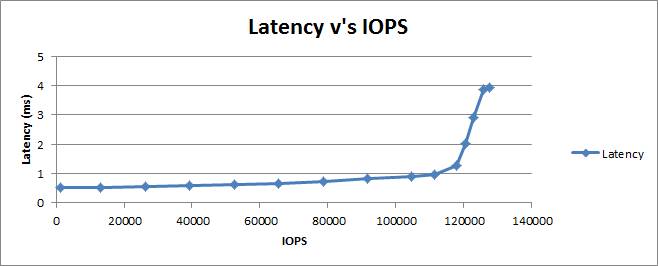
Looking at this graph we can clearly tell the true performance characteristics of the storage - both the maximum number of IOPS that we can achieve if we're not concerned about latency (~130K IOPS), but normally more importantly, the number of IOPS we can achieve whilst still maintaining a respectable latency (somewhere in the 115K-120K range depending on the latency you pick) - all by only running a single Vdbench test!