The Latency/Threads Relationship and HA Testing
One of the most common mistakes people make when testing storage is that they think they are measuring IOPS or bandwidth, when all that they are actually measuring is latency.
As a simple example, lets say that we have a storage device that takes 1ms to respond to an IO (including the SAN overheads, etc). If we configure our testing software to use a single thread (or worker, or outstanding IO, or whatever the particular tool calls it), then by definition the testing software is only going to send a single request to the storage, wait for it to respond, and then send another request. With a latency of 1ms, we can do that 1,000 times per second (each request takes 1ms, and there are 1000x 1ms in a second, so 1000 IOPS).
From that we could conclude that the storage can do 1,000 IOPS, at a latency of 1ms, and whilst that statement is correct, it's not helpful. It looks like we're stating 2 pieces of information (IOPS and latency), but in fact we're only stating one - the latency. The number of IOPS is simply derived from the latency.
If I then test a second array that has a latency of 2ms, I'll only get 500 IOPS from it (2ms x 500 = 1 second). Does that mean that the second array can only achieve half as many IOPS as the first? Of course not, because the test we're doing isn't actually measuring IOPS in any meaningful sense - it's measuring latency. The number of IOPS we see has a straight-line relationship to that latency.
As an example I ran the same workload using Vdbench against two drives - one a single SSD drive directly attached to a server, and the other an XtremIO array connected via a SAN. Vdbench was configured to do as many 8K IOPS as it could, 70% read, 30% write, 100% random. All using one thread.
The single SSD managed just over 3K IOPS :
Dec 09, 2016  interval        i/o   MB/sec   bytes   read     resp     read    write     resp     resp queue  cpu%  cpu%
                             rate  1024**2     i/o    pct     time     resp     resp      max   stddev depth sys+u   sys
14:23:39.066 avg_16-75    3192.92    24.94    8192  69.85    0.310    0.397    0.110    8.763    0.378   1.0  10.7   8.8
Whilst the XtremIO managed only a little under 2K IOPS :
Dec 09, 2016  interval        i/o   MB/sec   bytes   read     resp     read    write     resp     resp queue  cpu%  cpu%
                             rate  1024**2     i/o    pct     time     resp     resp      max   stddev depth sys+u   sys
14:25:41.060 avg_16-75    1942.41    15.18    8192  69.69    0.509    0.555    0.405   94.788    2.046   1.0   1.5   0.9
Does that mean that a single SSD can handle more IOPS than XtremIO? Of course not! The figure we should be looking at here is the response time - 0.310 for the SSD, 0.509 for XtremIO. Not surprisingly the array had a higher latency - not only is it doing more work than the SSD (dedup, compression, etc), it's doing it via a SAN which will also add latency.
If we look at the latency from both of these tests, we can see exactly what I described above. The SSD had an average latency of 0.310ms. With a single thread, that means we can do about 1/0.310 IO per millisecond, or around 1000/0.310 IO per second. That's around 3,225 IOPS - almost exactly what Vdbench managed to achieve. For the XtremIO, the average latency was 0.509ms, or 1000/0.509 IOPS, which is 1,964 - again almost exactly what we hit. (The IOPS will be slightly lower than the calculations as we're ignoring the time it takes vdbench to finish one IO and start the next)
Our limiting factors here are the latency of the storage, and the fact that we're only asking it to service one request at a time - which is very unrealistic for a modern workload. If we increase the number of threads to 2 we see very different results.
For the SSD, the number of IOPS doesn't change much at all, but we see an increase in latency :
Dec 09, 2016  interval        i/o   MB/sec   bytes   read     resp     read    write     resp     resp queue  cpu%  cpu%
                             rate  1024**2     i/o    pct     time     resp     resp      max   stddev depth sys+u   sys
14:32:38.065 avg_16-75    3305.57    25.82    8192  69.84    0.602    0.691    0.395   12.049    0.480   2.0   3.9   1.7
However on the XtremIO we see latency actually drop (which seems to actually be an artifact of Vdbench - it works better with >=2 threads than it does with one), which means our number of IOPS goes up significantly :
Dec 09, 2016  interval        i/o   MB/sec   bytes   read     resp     read    write     resp     resp queue  cpu%  cpu%
                             rate  1024**2     i/o    pct     time     resp     resp      max   stddev depth sys+u   sys
14:34:17.051 avg_16-75    4367.64    34.12    8192  69.95    0.454    0.491    0.369   92.024    0.267   2.0   2.3   1.5
Doing the same math as above, our average latency is now 0.454ms, but now in effect we've got 2000ms in every second - because we've got 2 threads running simultaneously. 2000/0.454 gives an expected IOPS of 4,405 - once again almost exactly what we achieved.
Increasing to 4 threads and the difference becomes even more pronounced. For the SSD :
Dec 09, 2016  interval        i/o   MB/sec   bytes   read     resp     read    write     resp     resp queue  cpu%  cpu%
                             rate  1024**2     i/o    pct     time     resp     resp      max   stddev depth sys+u   sys
17:20:49.075 avg_16-75    3312.41    25.88    8192  69.86    1.204    1.298    0.986   82.493    3.286   4.0   3.6   1.6
And for XtremIO :
Dec 09, 2016  interval        i/o   MB/sec   bytes   read     resp     read    write     resp     resp queue  cpu%  cpu%
                             rate  1024**2     i/o    pct     time     resp     resp      max   stddev depth sys+u   sys
15:06:02.058 avg_16-75    8542.79    66.74    8192  69.99    0.465    0.499    0.384   15.208    0.106   4.0   3.5   2.5
And up to 16 threads. SSD :
Dec 09, 2016  interval        i/o   MB/sec   bytes   read     resp     read    write     resp     resp queue  cpu%  cpu%
                             rate  1024**2     i/o    pct     time     resp     resp      max   stddev depth sys+u   sys
17:24:08.080 avg_16-75    3300.77    25.79    8192  69.85    4.844    4.931    4.643   90.548    6.916  16.0   3.7   1.5
XtremIO:
Dec 09, 2016  interval        i/o   MB/sec   bytes   read     resp     read    write     resp     resp queue  cpu%  cpu%
                             rate  1024**2     i/o    pct     time     resp     resp      max   stddev depth sys+u   sys
15:07:32.051 avg_16-75   30078.15   234.99    8192  70.04    0.529    0.561    0.456    9.067    0.128  15.9   9.8   7.7
The correlation between response time and IOPS holds true through all of the tests. The single SSD test maxes out the number of IOPS fairly early, and as a result the latency grows as queuing starts to occur. The XtremIO IOPS grow with the number of threads, although there is a slight increase in latency which is expected as we start to get some queuing occurring which means that the IOPS growth isn't perfectly linear.
HA Testing
So what has this got to do with HA testing? In general, when an array is recovering from an HA event the latency of the array will go up, at least a little. In the 2 thread test above, the XtremIO array gave an average response time of 0.454ms, which gave us around 4400 IOPS. Re-running the same test shortly after failing an SSD - whilst the rebuild is still in progress - pushes the average latency up a little to 0.673ms.
Dec 12, 2016  interval        i/o   MB/sec   bytes   read     resp     read    write     resp     resp queue  cpu%  cpu%
                             rate  1024**2     i/o    pct     time     resp     resp      max   stddev depth sys+u   sys
11:46:56.057 avg_16-75    2946.38    23.02    8192  69.82    0.673    0.756    0.482   14.279    0.382   2.0   2.1   1.3
Most people wouldn't be concerned about a slight increase in latency like this during a drive rebuild, however due to us running with a limited number of threads the increase in latency has led to a significant reduction in the number of IOPS - from almost 4,400 down to just under 3,000 IOPS! This drop is expected, and it matches our previous calculations (2x1000/0.673 = 2,971), but the problem is that people will incorrectly imply from this that the disk failure has caused a ~30% drop in the performance of the array, which is simply not correct. The drop in IOPS is directly related to the increase in latency, and does not mean that the raw performance capability of the array has dropped by 30%.
In addition to the HA problem, testing when thread-bound makes it very difficult to determine the true characteristics of the array. For example, if we look at the single SSD results above with 16 threads we see 3,300 IOPS at a latency of almost 5ms. If that was the only data-point we'd tested, we could come to the conclusion that this SSD had very poor performance - although it could obtain a fairly reasonably 3,300 IOPS, it did it at a very high latency. However if we look at the other results we can see that with a single thread it was able to general almost as many IOPS, but with a latency of only 0.31ms - over an order of magnitude lower! In this case it's fairly clear that the SSD maxed out somewhere between 1 and 2 threads, but in most cases it's not going to be this easy - especially with a high-performance storage array where you will potentially need hundreds of outstanding IOs in order to determine it's maximum performance - and it's not realistic to try every single value of threads/number of luns/etc to find that sweet spot.
In order to avoid this problem, we need to break the relationship between threads/workers/outstanding IO and the number of IOPS we're generating. Some testing tools allow you to do this via some means or other of setting a maximum/target number of IOPS - whilst others do not. If you're using a tool that doesn't, then it's probably a good indication that you're using the wrong testing tool...
To use Vdbench as an example, it allows us to configure the number of IOPS that we want it to generate using the "iorate=" setting. For the tests above, I had this set to "iorate=max" which forces it to generate the maximum number of IOPS it can with the number of threads configured, but by setting it to a target number like "iorate=10000" then it will attempt to generate that number of IOPS, and as a result give you a much better indication of latency at that point. As the testing is now IOPS-based rather than latency based, you'll also get more meaningful results during a HA event.
I said "attempt to generate" above, because obviously there's still a few things that can limit the number of IOPS, which means that it may not actually make it to the request target IOPS. The most obvious of these is the performance capability of the array - if I ask Vdbench to generate 10000 IOPS on my single SSD it's clearly not going to be able to do it. The second limit is the number of threads we've configured - we've shown above that with 2 threads configured we can only generate around 4.4K IOPS on XtremIO, and asking Vdbench to generate 10000 IOPS with 2 threads isn't going to change that result!
The solution for this is simple - configure far more threads than we need. Normally configuring too many threads will have the negative result of increasing latency - as we saw above for the SSD - but the combination of a limited number of IOPS AND a larger-than-needed number of threads gives us the ability to measure latency at one or more numbers of IOPS. What's more, it allows us to do so in a way that isn't controlled by the latency, so we can see the more real-world impact of things like failures/HA.
For example, say I want to test my XtremIO at 20,000 IOPS. From the results above, I know that with 16 threads I can generate about 30k IOPS at normal (non-HA) latency, so that would probably be enough for my 20k IOPS test - but (within reason) there's no real disadvantage of going high so why not configure it with 32 threads (or even 64 or 128!)
rd=8k_7030,wd=8k_7030,iorate=20000,interval=1,elapsed=60,warmup=15,threads=32
Running this on a healthy array shows pretty much what we'd expect - 20K IOPS being generated, and latency where we would expect based on the results above.
Dec 12, 2016  interval        i/o   MB/sec   bytes   read     resp     read    write     resp     resp queue  cpu%  cpu%
                             rate  1024**2     i/o    pct     time     resp     resp      max   stddev depth sys+u   sys
12:37:33.053 avg_16-75   19979.28   156.09    8192  70.02    0.564    0.595    0.491   16.130    0.192  11.3  18.3  15.6
Re-running it on an array that is in the middle of a disk rebuild shows the power of testing this way - we still get our 20K IOPS, but the latency has increased so we can measure the real impact of the SSD failure/rebuild.
Dec 12, 2016  interval        i/o   MB/sec   bytes   read     resp     read    write     resp     resp queue  cpu%  cpu%
                             rate  1024**2     i/o    pct     time     resp     resp      max   stddev depth sys+u   sys
12:41:04.052 avg_16-75   20004.95   156.29    8192  70.01    0.761    0.837    0.585   16.039    0.393  15.2  16.0  13.5
By using IOPS as the basis for the testing, rather than threads, we've managed to make the testing not only more realistic for most workloads, but also managed to show the true impact of a failure - a small increase in latency, rather than the indirect effect that higher latency causes when we are using a thread-limited testing tool!
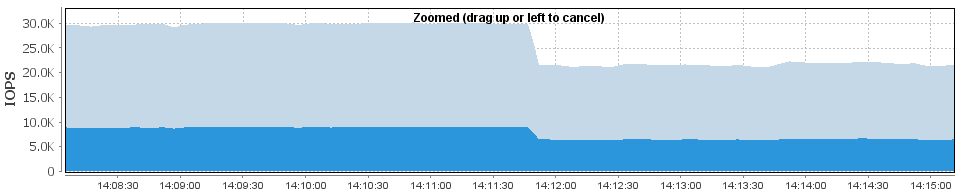
From the array perspective, here's a failed SSD when running with a fixed number of threads (16) and "max" IOPS (which gives about 30K IOPS, as seen above) :
rd=8k_7030,wd=8k_7030,iorate=max,interval=1,elapsed=9999,threads=16
Here's the exact same situation, only using a much larger number of threads, and limiting the number of IOPS to the same 30K :
rd=8k_7030,wd=8k_7030,iorate=30000,interval=1,elapsed=9999,threads=64
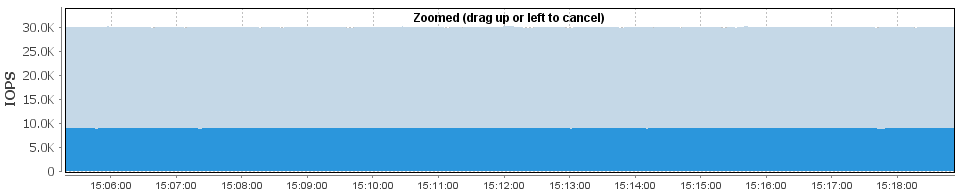
In case you're wondering, the SSD "failed" about halfway into that graph. Of course, you can't see it as there was no impact to the performance when it happened! Some other tests (eg, Storage Controller failure) may not be quite as clean as this in that you might see a momentary drop in I/O - but they will show far less impact than if you're controlling the workload using threads.
Vdbench can also take IOPS limiting a step further using the "iorate=curve" command which is the best way to funny understand the performance characteristics of an array. You can read more about that in a previous post.