Queue Depth, IOPS and Latency
Queue depth, or more specifically concepts like the number of outstanding IO or the number of "threads" used in a testing tool, is one of the more misunderstood concepts with performance testing.
Whatever the name, these concepts refer to the (maximum) number of IO that can be outstanding to a device at once - whether that limit is controlled by the testing software, the OS, the HBA, or all of these. To understand why this is important, we first need to understand the relationship between IOPS and latency.
By definition, each "thread" is a single-threaded IO operation. On a per-thread basis, a new IO will not be started until the preceding IO has completed. This fairly clearly gives us a relationship between the time that each operation takes to complete (ie, the latency) and the number of operations that can be competed per time unit (ie, IOPS). If each IO takes 0.1 seconds to run (100ms), then fairly clearly the maximum number of IOPS that can be generated is 10. If each IO takes 0.02 seconds (20ms), then we can do 50 IOPS. More generically, for each thread we can generate at most (1/L) IOPS, where L is the latency in seconds.
This behavior is easy to show with vdbench. In this case I've configured vdbench to generate "max" IOPS, but with only a single threads. The results of a 60 second run show :
Oct 26, 2015  interval        i/o   MB/sec   bytes   read     resp     read    write     resp     resp queue  cpu%  cpu%

rate  1024**2     i/o    pct     time     resp     resp      max   stddev depth sys+u   sys

10:22:28.060  avg_6-65    1782.98    13.93    8192 100.00    0.507    0.507    0.000   19.850    1.701   0.9   2.4   1.4
This shows an average response time of 0.507 milliseconds, or 0.000507 seconds. Using the math above, this gives an expected number of IOPS of 1/0.000507, or 1972 IOPS. This is slightly above what we saw, due to additional overheads introduced by vdbench (note that the average queue depth was only 0.9 - with only 1 thread configured vdbench seems to have trouble actually keeping 1 IO outstanding at all times).
Running the same test with 2 threads configured gives :
Oct 26, 2015  interval        i/o   MB/sec   bytes   read     resp     read    write     resp     resp queue  cpu%  cpu%

rate  1024**2     i/o    pct     time     resp     resp      max   stddev depth sys+u   sys

10:24:41.051  avg_6-65    4274.60    33.40    8192 100.00    0.460    0.460    0.000   22.917    0.111   2.0   4.1   2.5
With an average latency of 0.460ms, this gives 1/0.000460 IOPS per threads, which is 2174 IOPS per thread, or around 4348 IOPS total. Again this is slight more than vdbench actually achieved, but that's just down to vdbench overheads again.
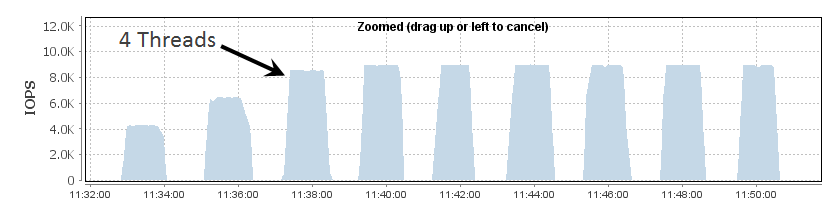
Not surprisingly, this continues to scale as the number of threads increased - 6450 IOPS with 3 threads (0.459ms latency) and 8520 IOPS with 4 threads (0.463ms latency).
Tools like vdbench will allow you to increase the number of threads/outstanding IO almost without bounds, but as you do so you'll eventually hit another limit - the HBA Queue Depth. In order to demonstrate this, I've lowered the HBA Queue Depth on my host to 4 and then run the same vdbench run as above with the threads increasing from 2 to 10. The results as shown on the array are :
Not surprisingly the number of IOPS increases with the number of threads - but then flat-lines once we get to 4 outstanding IOs - matching the queue depth configured on the HBA. Once we get above this number vdbench will continue to attempt to generate IO requests, but these requests will simply queue at the host level. We can see this happening by looking at the latency - at the array level the latency is flat-line across all of the tests :
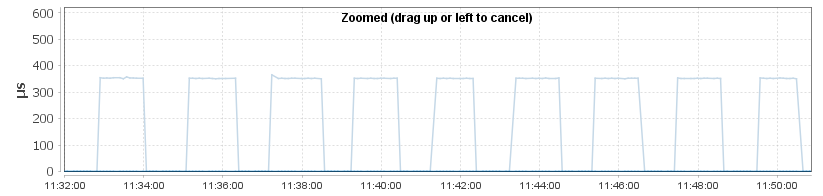
In the vdbench results, the latency is perfectly stable for 2 to 4 threads (0.462ms, 0.461ms, 0.463ms), however once we get to 5 threads the latency starts to grow - going from 0.554ms for 5 threads all the way up to 1.109ms for 10 threads (0.663ms for 6 threads, 0.775ms for 7 threads , 0.885ms for 8 threads, 0.997ms for 9 threads). This is exactly the behavior you'll see when the HBA queue depth is exceeded - everything will continue to work, however host-measured latency will increase despite the array latency being flat due to the additional queueing occurring on the host.
Effective Queue Depth
In most environments, the effect queue depth - being the number of IO's that can actually be outstanding for a single LUN - is higher than the actual HBA queue depth. This is due to the use of host multipathing, where there are multiple paths to each physical LUN. Multipathing is done at the OS level, so from the HBA perspective each of the paths to a LUN is a unique LUN - which means that the number of outstanding IO's across those paths is additive for each path to the LUN.
The testing above was done using only a single path, so the effective queue depth was the same as the real queue depth (ie, 4). However the LUN being used actually has 4 paths to it :
3514f0c5e5cc00001 dm-7 XtremIO,XtremApp
size=800G features='0' hwhandler='0' wp=rw
`-+- policy='queue-length 0' prio=1 status=active
  |- 4:0:11:1 sdd 8:48  active ready running
  |- 4:0:12:1 sde 8:64  active ready running
  |- 4:0:13:1 sdf 8:80  active ready running
   - 4:0:14:1 sdg 8:96  active ready running
Re-running the testing using the multipath device (/dev/dm-7) gives very different results :
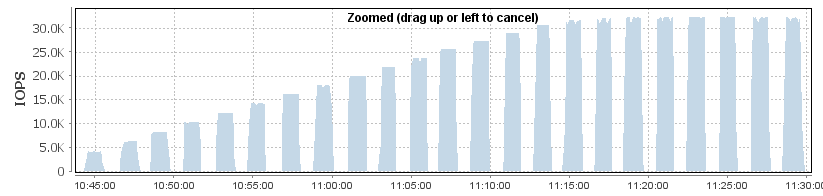
In this case the performance keeps increasing beyond 4 threads - all the way up to 16 threads. This is exactly what was expected, as the effective queue depth is the actual queue depth (4) times the number of paths (4), giving an outstanding IO count of 16 before hosts-level queueing starts.
The end result of this is that the more paths a LUN has, the less important the HBA queue depth is. Most HBA's have a default queue depth of around 32, which if our storage can maintain a response time of 1ms (measured at the application) then we know that this is enough to generate up to around (32x1/0.001=) 32,000 IOPS. If we have only 1 path to the LUN then that's our maximum possibly number of IOPS, however the same LUN with 4 paths would be able to do over 100,000 IOPS to this LUN.
Of course, there is a flip-side to this - effective queue depth drops when a path fails. Just like it's important to make sure you have sufficient bandwidth available when a path/switch/etc fails, it's also important to make sure you have sufficient queue depth when that happens.